Building a Personal Research Engine with sigint and Claude Code
I wrote about sigint when I first released it back in January. That post covered the plugin itself: swarm-orchestrated research, three-valued trend logic, report generation. Useful stuff, but it was about the tool.
This post is about what I built on top of it.
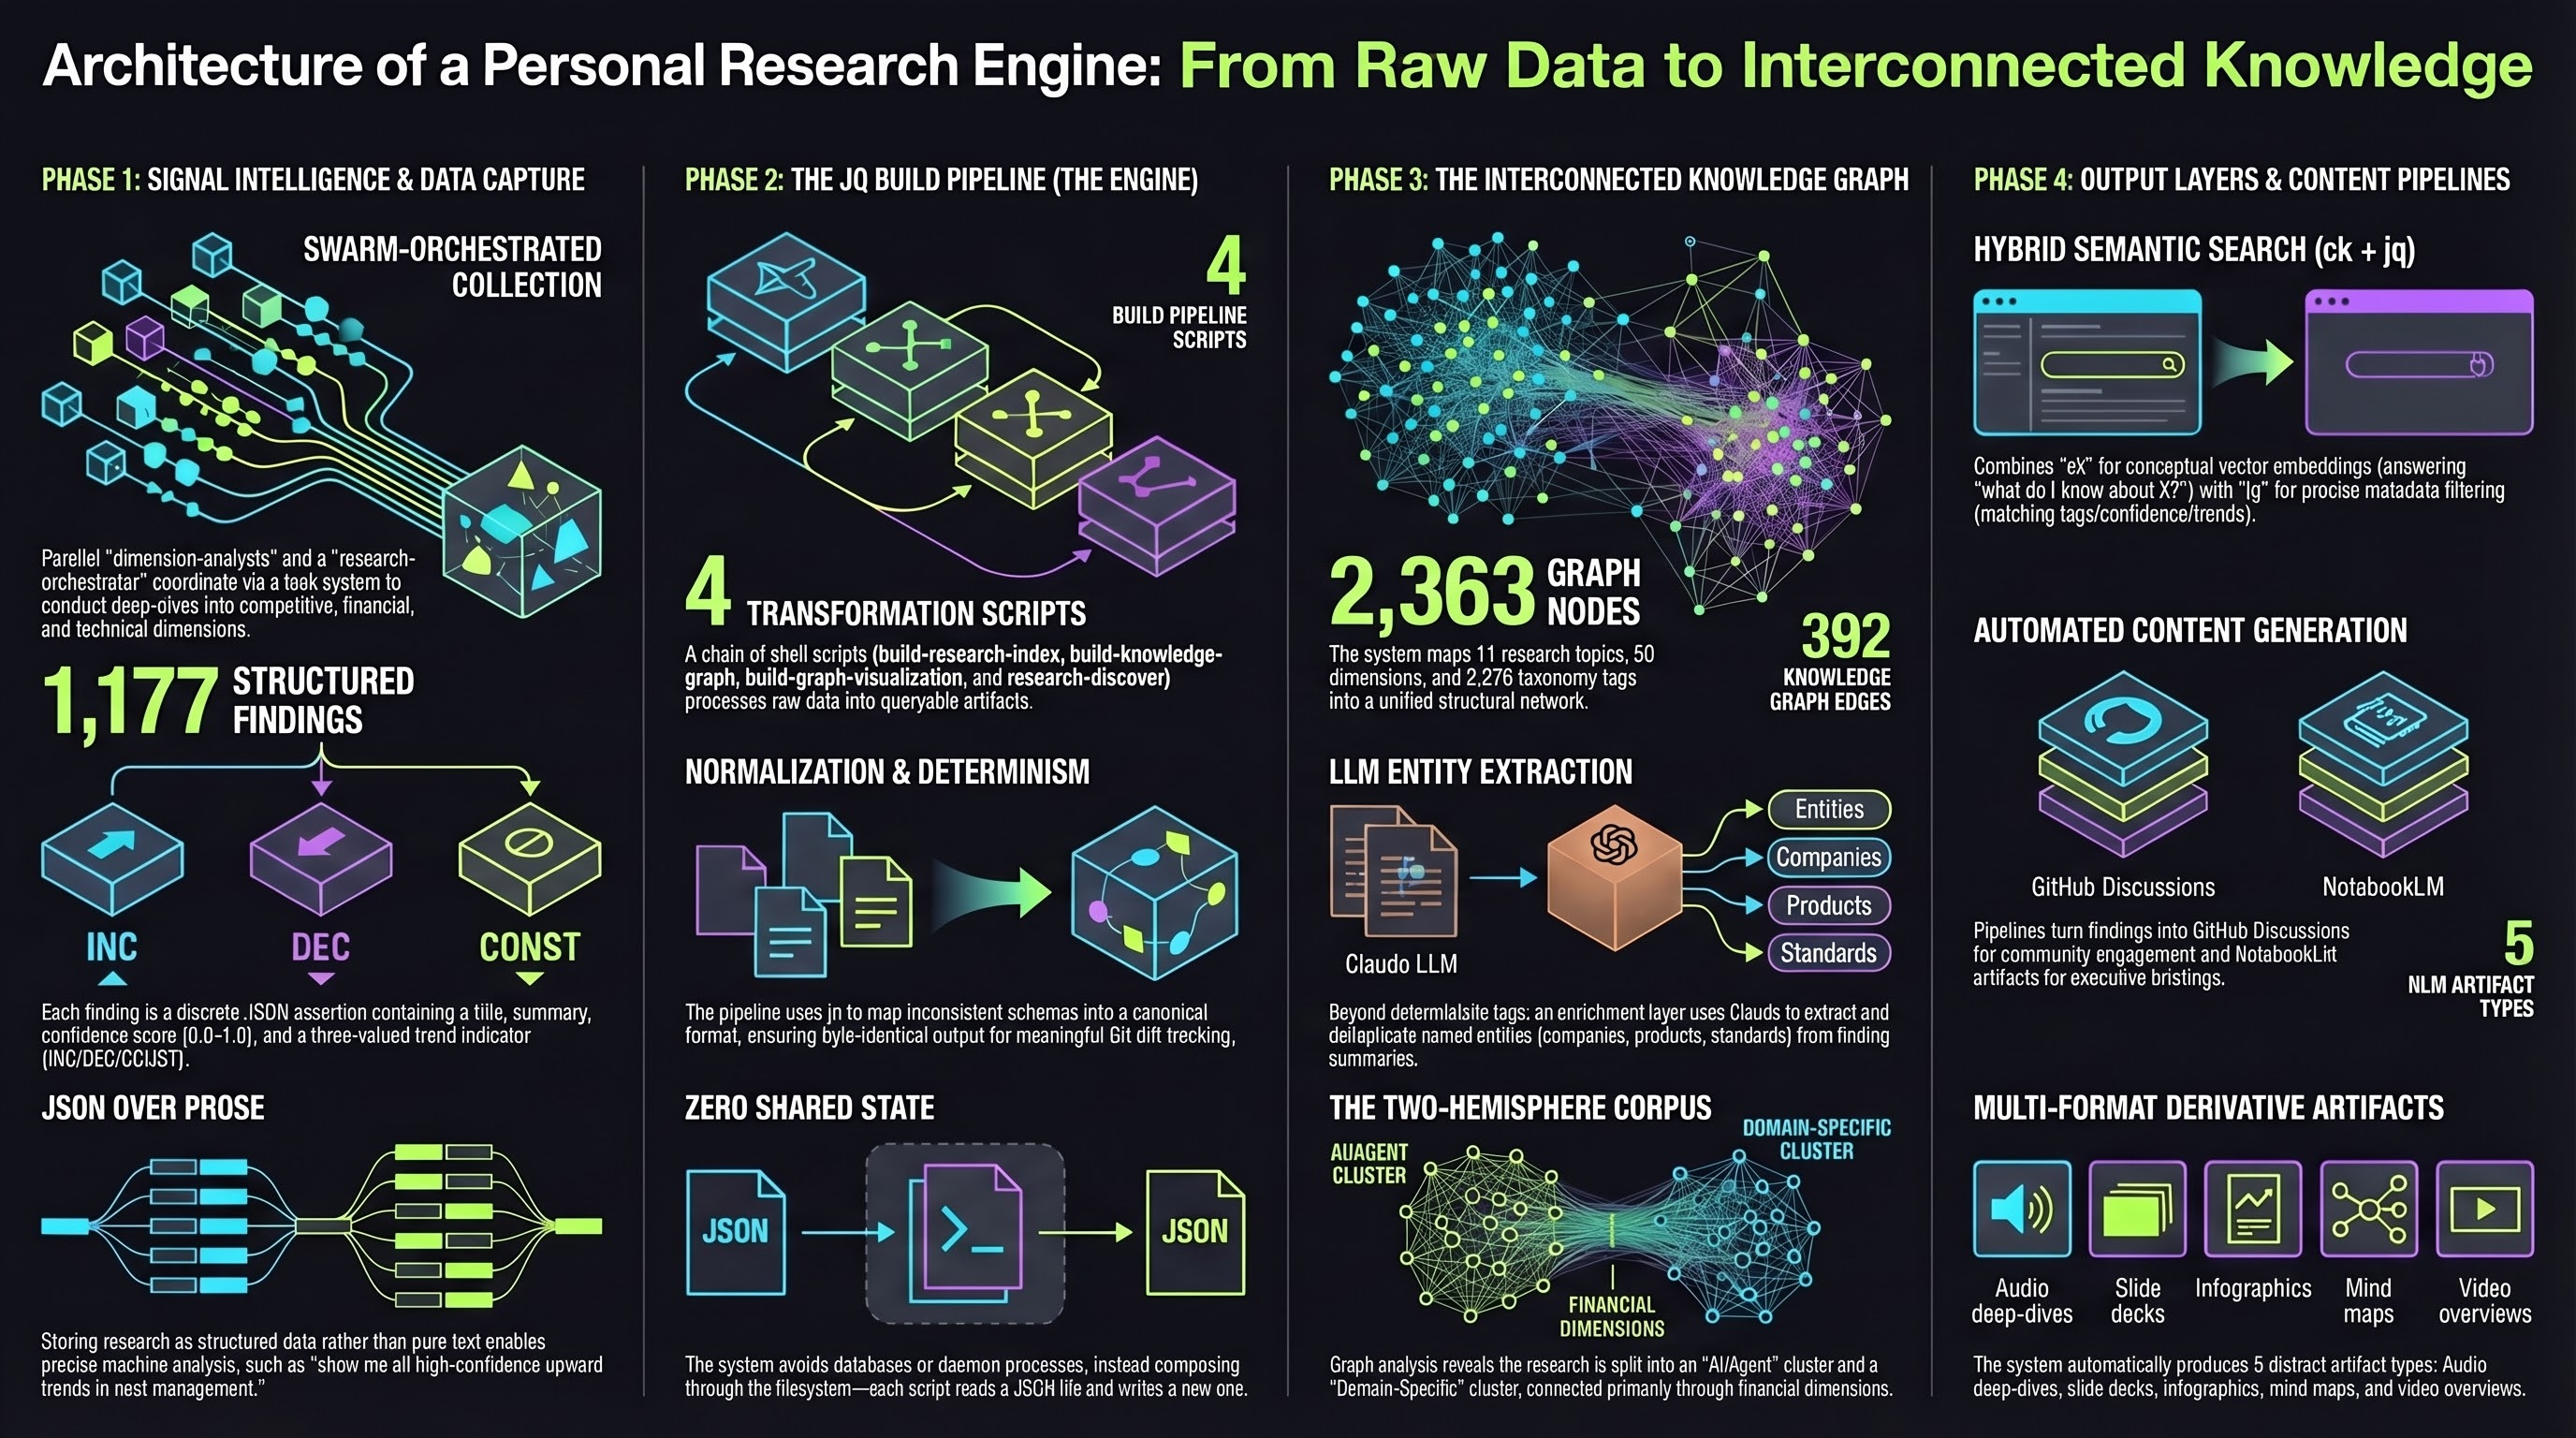
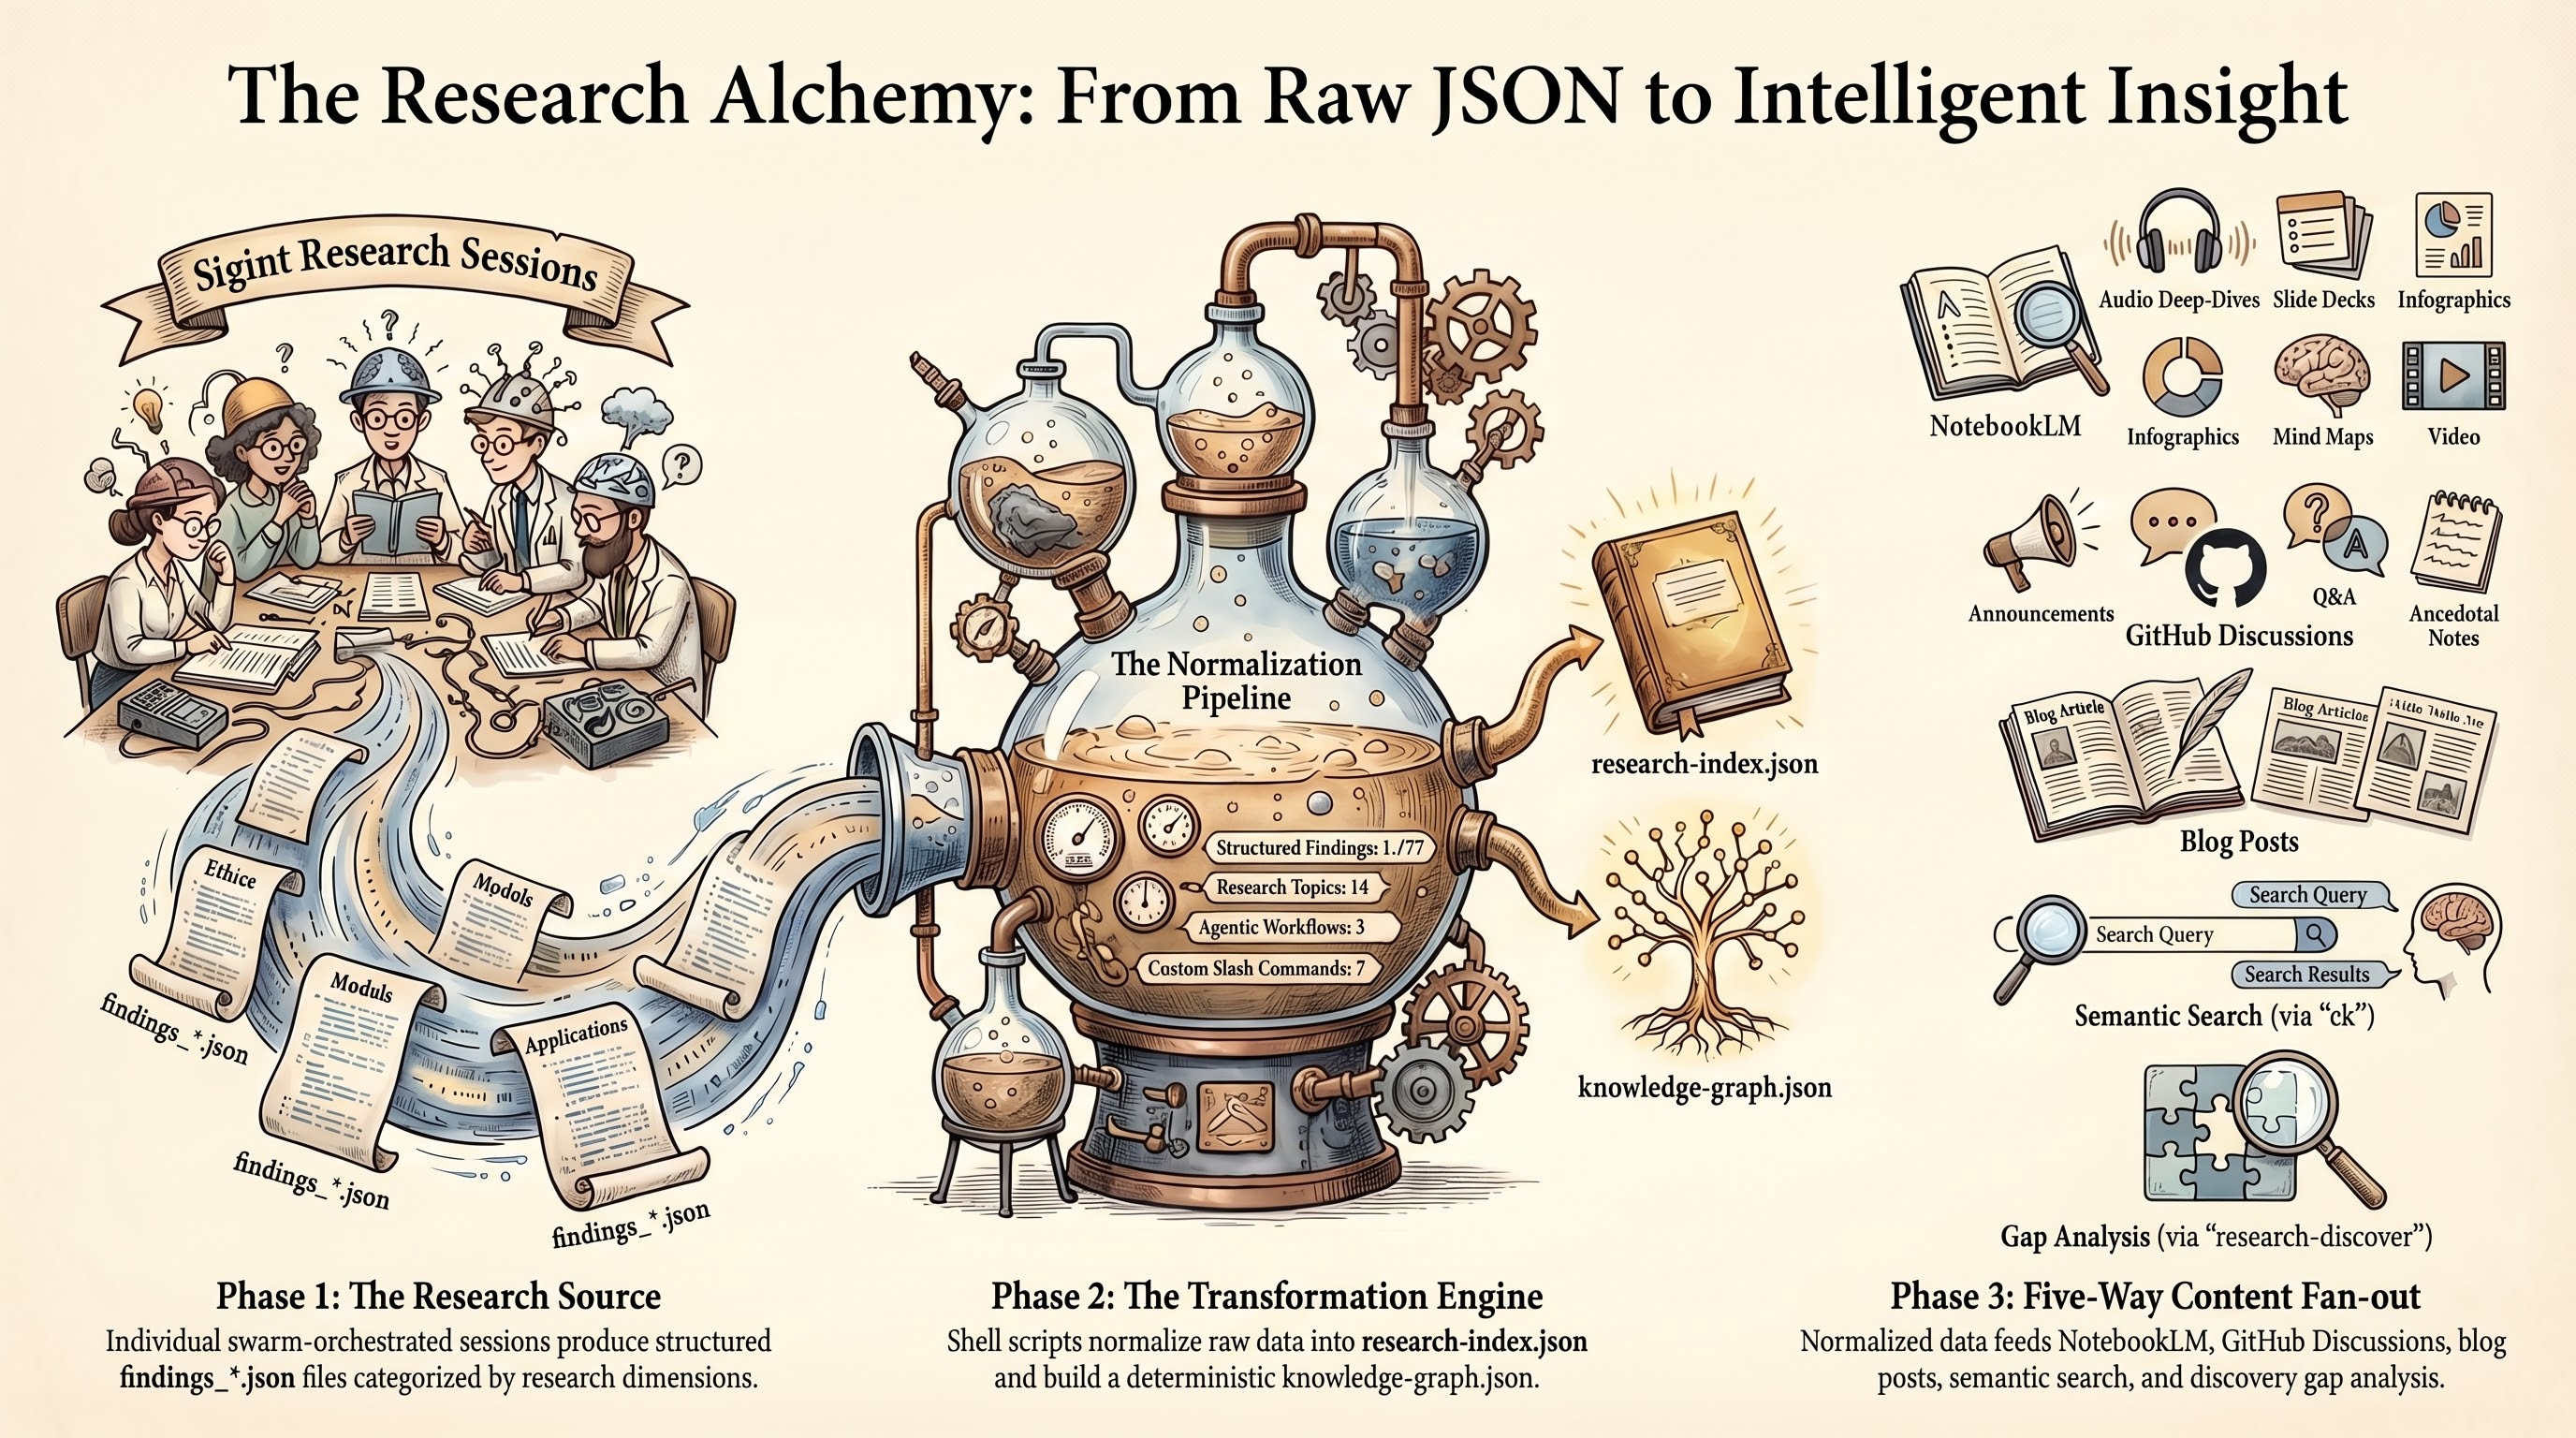
Three months and 1,177 findings later, the sigint plugin is the engine, but the research repository is the product. It has its own knowledge graph, its own semantic search, its own content pipelines. Findings flow from sigint into structured JSON, get indexed for hybrid search, connect through entity extraction, publish to GitHub Discussions, and feed into NotebookLM for audio deep-dives and slide decks. Individual findings become blog posts. Cross-topic clusters spark new research directions.
The plugin does the data collection. Everything after that is custom tooling I layered on top, and that layering is what I want to walk through here.
The Shape of the Problem
Research accumulates. The first topic is easy to manage. By the fifth, you start losing track of what connects to what. By the tenth, you have over 800 structured findings spanning software engineering and agriculture, and the only way to navigate that is tooling.
I needed three things that sigint alone does not provide:
- A way to search across all topics at once, including concepts I had not explicitly tagged
- A way to see how topics connect to each other through shared entities, dimensions, and themes
- A way to turn raw findings into derivative content without re-reading every report from scratch
The research repository (zircote/research) is the answer to all three. It sits downstream from sigint and upstream from everything else: blog posts, conference talks, NotebookLM briefings, GitHub Discussions, and whatever I decide to build next.
Architecture: Structured JSON All the Way Down
Every sigint research session produces two outputs: narrative markdown reports (for reading) and structured JSON findings (for machines). Each finding is a single assertion with a title, summary, confidence score from 0.0 to 1.0, trend indicator (INC/DEC/CONST), tags, dimension, and source citations.
This structure is the foundation. You can ask “show me all high-confidence findings trending upward about cost management” and get a precise answer. You cannot do that with prose.
The file layout for each topic looks like this:
reports/topic-slug/
  README.md                    # Topic index with key findings
  RESEARCH-REPORT.md           # Narrative report
  findings_competitive.json    # Structured findings per dimension
  findings_financial.json
  findings_tech.json
  findings_trends.json
  methodology_plan_*.json      # Research methodology plans
  _assets/                     # NLM artifacts (audio, infographics)
    manifest.json              # Artifact registry
  slides/                      # Executive slide decks
Every topic follows this layout. The consistency matters because every downstream tool knows exactly where to find data.
The Build Pipeline
Four shell scripts transform raw findings into queryable artifacts, chained through the filesystem:
build-research-index.sh reads all findings_*.json files across every topic and normalizes them into a single research-index.json. Normalization handles schema drift between research sessions: some findings use summary, others content; some express confidence as a float, others as “high”. The script maps everything to a consistent schema.
build-knowledge-graph.sh reads the config and index to produce knowledge-graph.json with nodes for topics, dimensions, and tags, plus edges for shared structure.
build-graph-visualization.sh injects the graph JSON into an HTML template for an interactive force-directed D3.js visualization.
research-discover.sh reads the index and graph to produce pre-computed gap analysis, clusters, stale findings, and topic suggestions.
Each script has one job and one output file. They compose through the filesystem. No shared state, no database, no daemon process. The entire thing runs with jq and a shell.
I chose jq over SQLite or Python deliberately. For ~1,200 findings, jq processes the full index in under a second. The scripts produce deterministic output: same inputs, byte-identical JSON. That means the generated artifacts produce meaningful git diffs, which double as a machine-readable changelog.
The Knowledge Graph: How Research Connects
The knowledge graph answers “how does my research connect?” rather than “what did I find?” It sits above individual findings and maps relationships between topics.
Four node types:
| Type | Example | Count |
|---|---|---|
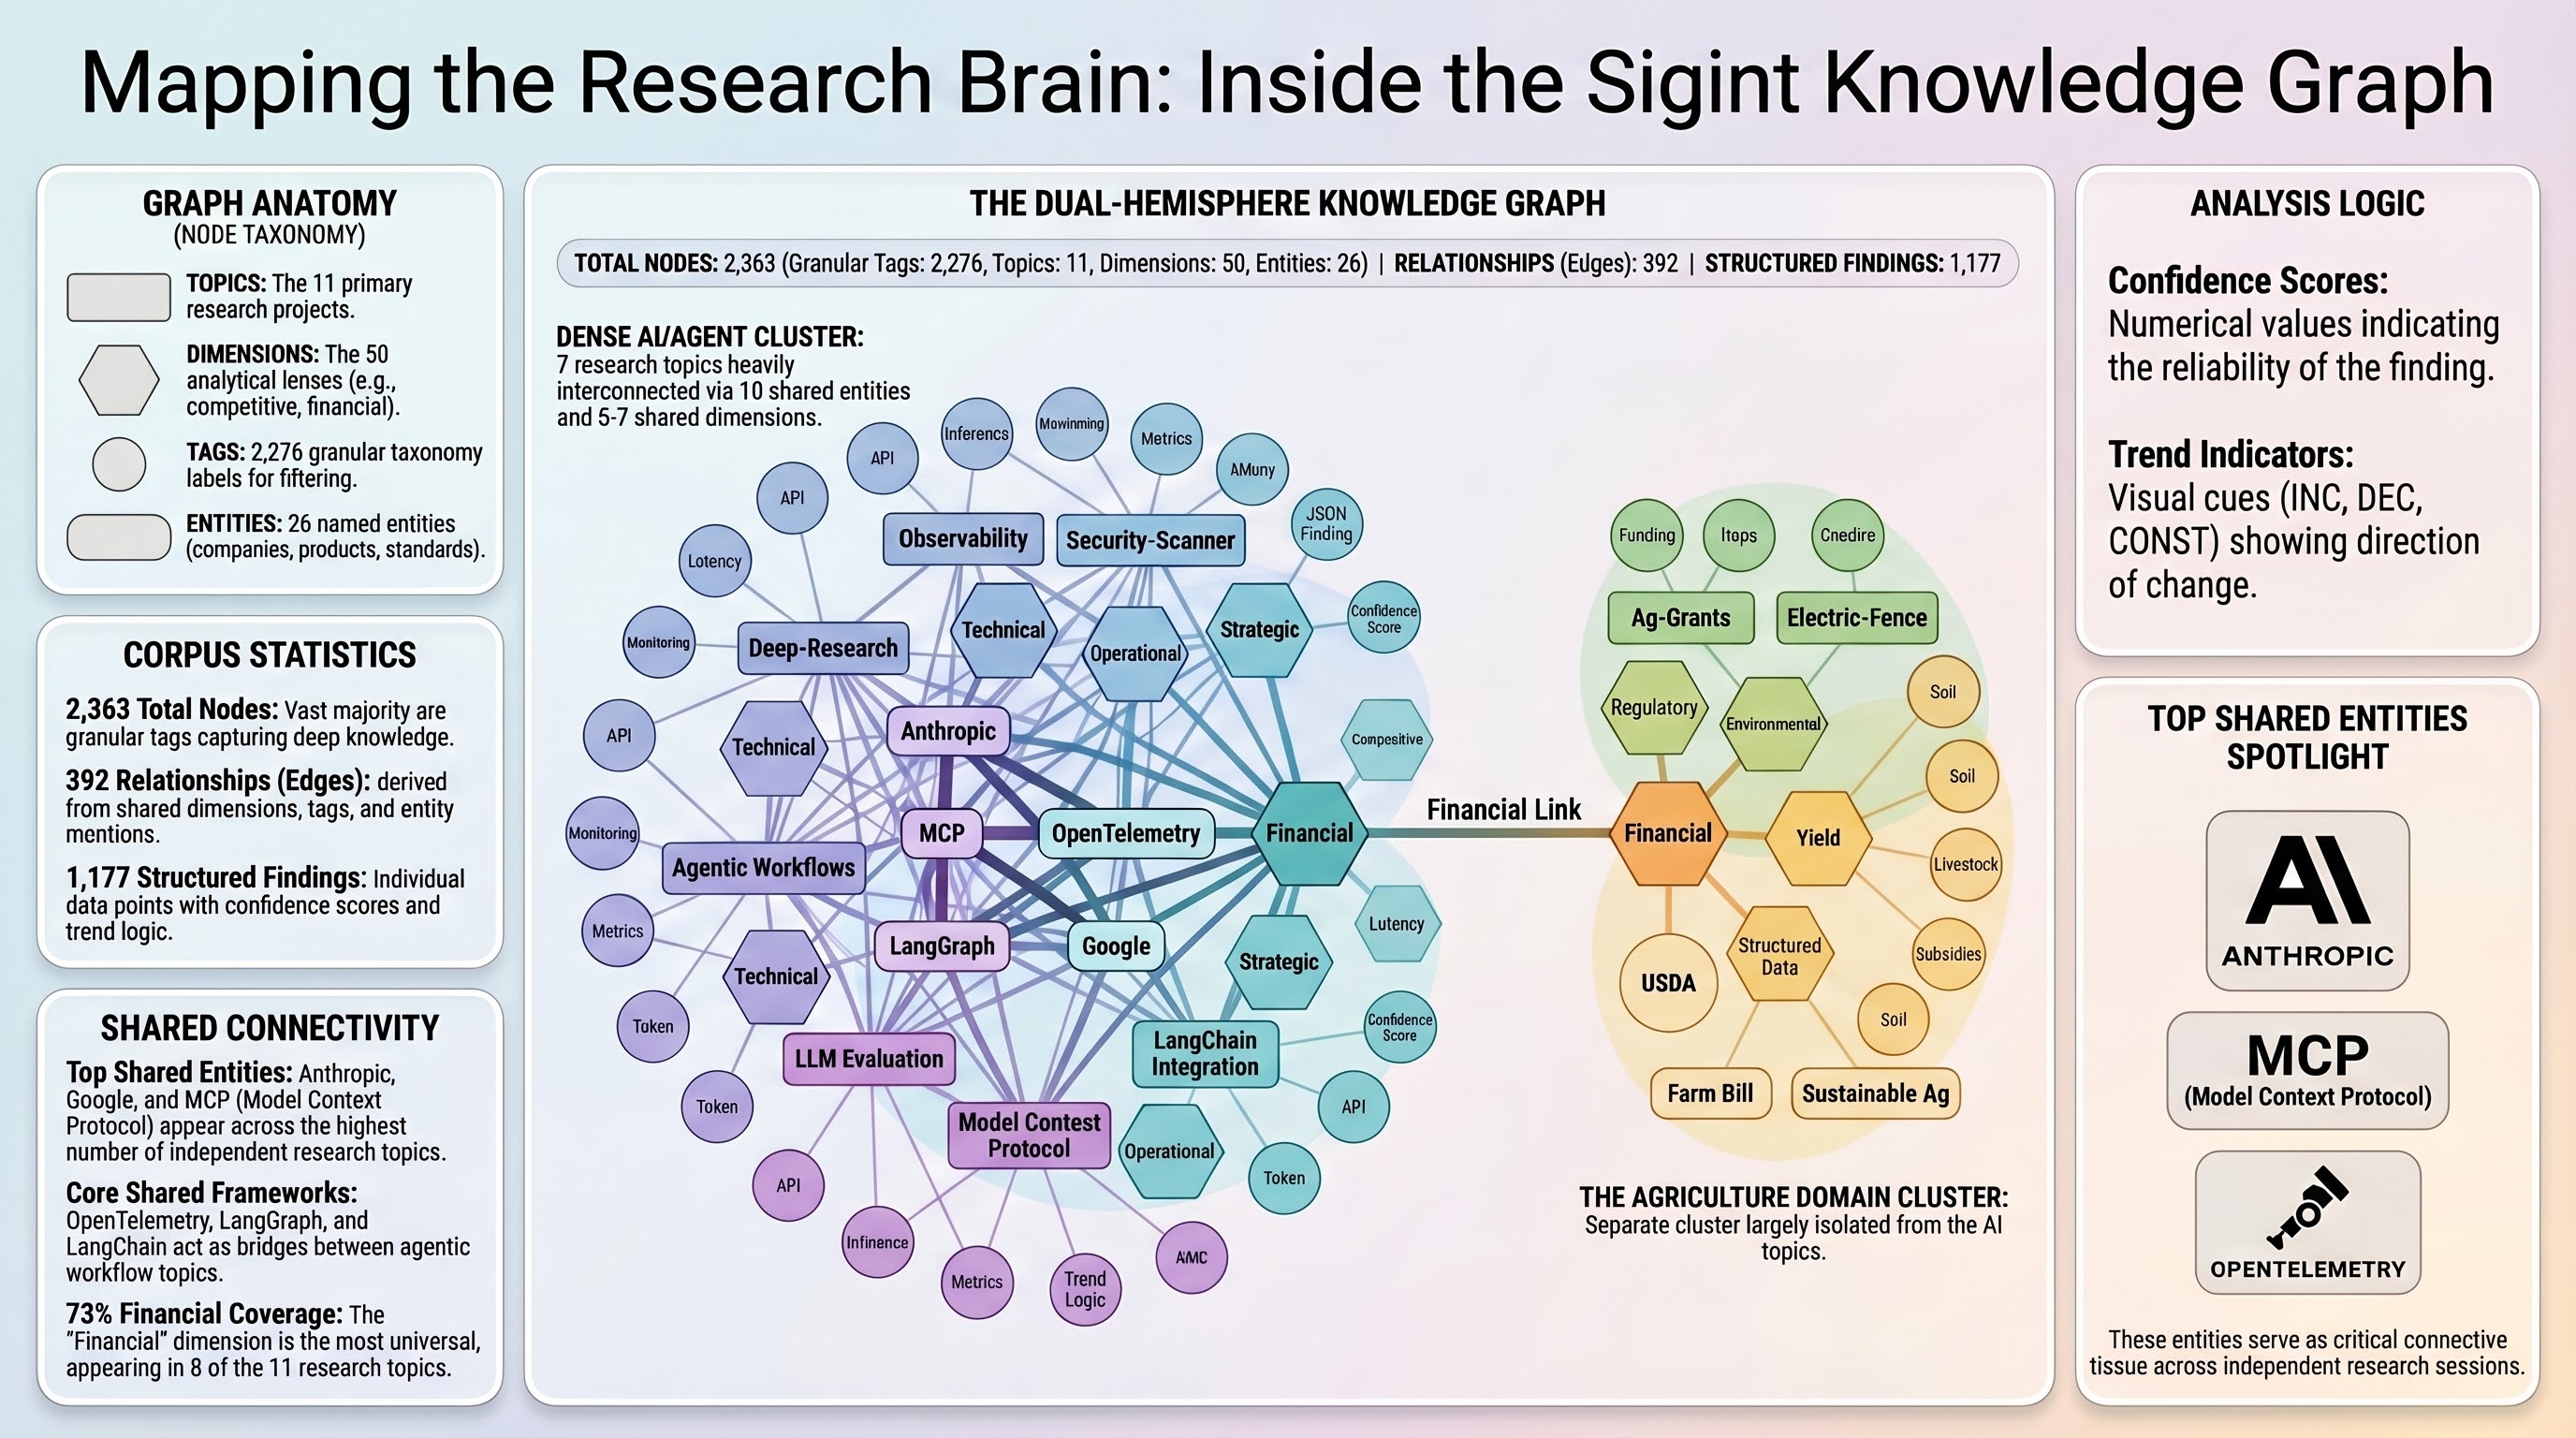
| topic | topic:my-research-area | 11 |
| dimension | dimension:competitive | 50 |
| tag | tag:mcp | 2,276 |
| entity | entity:Anthropic | 26 |
The first three are deterministic, built from sigint.config.json. Entities are different. They come from LLM extraction against finding summaries: I run /research-graph --enrich, and Claude reads finding text in batches, extracts named entities (companies, products, standards, frameworks), deduplicates them, and creates nodes for entities mentioned across multiple topics.
This entity layer creates connections that tags miss entirely. Two topics might both reference MCP or OpenTelemetry without sharing any tags, because they were researched independently with different vocabularies. Entity enrichment surfaces those hidden relationships.
The graph currently has 2,363 nodes and 392 edges. The interesting structural observation: the corpus has two hemispheres. An AI/agent cluster (7 topics) is densely interconnected through 5-7 shared dimensions and 10 shared entities. A domain-specific cluster (agriculture, fencing, livestock) connects to the main graph only through the financial dimension. One topic sits between the clusters with unique dimensions linking it to both.
That structural insight came from the graph, not from reading reports. I would not have noticed it manually.
Semantic Search: Finding What You Forgot You Knew
The research corpus uses two search backends that compose rather than compete.
ck (a local hybrid search tool) combines BM25 keyword indexing with vector embeddings, fused through Reciprocal Rank Fusion. It runs entirely locally with no API keys. Searching for “agent reliability” surfaces findings about drift detection, failure recovery, and circuit breakers, even though none contain that exact phrase.
jq handles structured filtering: tag matching, confidence thresholds, trend filtering, dimension scoping. Deterministic, precise, no ranking ambiguity.
The typical workflow: semantic search to discover, structured filtering to narrow. Find everything conceptually related to “cost management in agentic systems” with ck, then filter to only high-confidence findings trending upward with jq.
The key design decision was one file per finding for the ck index. Each finding exports to reports/_findings-index/TOPIC--DIMENSION--ID.md with metadata in the header. This means ck’s unit of retrieval exactly matches the corpus’s unit of knowledge. When it returns a result, it is exactly one finding with a clear identity, not a document you need to manually search within.
# Semantic search
ck --json --hybrid "cost management" reports/_findings-index/ --limit 20

# Structured post-filter
jq '[.findings[] | select(.confidence >= 0.8 and .trend == "INC")]' research-index.json
When ck is not installed, the system falls back to jq regex matching. Less capable, but the corpus stays searchable with zero external dependencies beyond jq.
GitHub Discussions: The Knowledge Community Layer
Raw findings sitting in JSON files are useful for me. They are useless for anyone else unless I publish them somewhere accessible.
The /research-discuss command publishes research to GitHub Discussions with three distinct purposes:
| Type | Purpose |
|---|---|
| announce | Findings summaries when research completes or updates |
| question | Questions about methodology, interpretation, data sources |
| anecdotal | Non-canonical context: industry chatter, tangential observations, unverified signals |
Each research topic gets its own Discussion category. Announcements post structured summaries with confidence distributions, dimension breakdowns, and links to the full report. When I run /sigint:update and get new findings, I can append a delta update comment to the existing announcement rather than creating a duplicate.
The anecdotal type is the one I find most valuable. Not everything belongs in formal findings. Sometimes I hear something at a conference, read a throwaway line in a blog post, or notice a pattern that does not meet the evidence bar for a finding. Those observations go into discussions as anecdotal context, tagged to the relevant topic but clearly marked as unverified.
Two agentic workflows automate the discussion layer further:
Research Topic Onboard triggers on push to main when a new reports/*/README.md appears. It reads the topic metadata and posts a metro-style landing page discussion summarizing what the research covers, its dimensions, key findings, and available artifacts. New topics get a Discussion presence automatically.
Research Articles runs weekly on Monday mornings. It selects a research dimension or cross-cutting finding, writes a deep-dive article from the structured findings data, and posts it as a Discussion. These are not report republications. They are focused articles that pull specific findings, add analysis, and present one idea clearly. The workflow picks topics that have not been covered recently and dimensions with high-confidence findings worth highlighting.
The Content Pipeline: From Findings to Everything Else
This is the part that makes the whole system worth building. sigint collects structured data. The research repo indexes and connects it. The content pipeline turns it into things people actually consume.
NotebookLM Artifacts
The /nlm-artifacts command orchestrates Google NotebookLM to produce five artifact types from research data:
- Audio deep-dives: Two-host discussion format covering the 3-5 most surprising findings, competitive dynamics, and strategic implications. These run 10-15 minutes and work as executive briefings.
- Slide decks: Structured around the executive summary, one slide per dimension with key metrics, ending with recommendations.
- Infographic series: One per major dimension or cross-cutting insight. Each visualizes a single concept: a competitive landscape, a process flowchart, a market sizing breakdown.
- Mind maps: Branching from the core concept through each dimension to key findings.
- Video overviews: Narrative arc from problem through discoveries to conclusions.
The command handles the full lifecycle: creates a NotebookLM notebook, uploads the research report and findings as sources, crafts topic-specific prompts that reference actual data points (not generic instructions), monitors generation progress, downloads artifacts, and writes a manifest for future incremental updates.
Subsequent runs detect what changed since the last generation and refresh only the artifacts whose underlying dimensions have new findings. The manifest tracks which findings each artifact covers, so delta updates are targeted rather than full regenerations.
Blog Posts
The weekly Research Articles workflow generates focused articles from findings data. But I also write posts manually that draw from multiple research topics. The knowledge graph and search tools make this practical.
When I started writing a blog post on a topic that spanned multiple research areas, I searched /research-search with a key concept and got findings across three topics that I could synthesize. The graph showed me entity connections I had not considered. The NLM audio deep-dive gave me a narrative structure to react to rather than building one from scratch.
The research repository is not a CMS. It is a knowledge base that feeds content creation across formats.
Cross-Topic Ideation
The /research-discover command is where new ideas come from. It reports:
- Clusters: Topic pairs sharing 2+ tags, grouped into thematic neighborhoods
- Coverage gaps: A matrix of standard dimensions vs. topics, flagging where analysis is thin
- Stale findings: High-confidence, upward-trending findings in topics that have not been refreshed recently
- Topic suggestions: New research areas inferred from tag density patterns and gap analysis
I run this roughly weekly. The clusters tell me what I already know connects. The gaps tell me what I should investigate. The suggestions surface ideas I would not have generated on my own because they emerge from structural patterns in the data rather than from my own biases about what to research next.
How to Build This for Your Own Work
The pattern is more transferable than the specific tools. Here is what you need:
1. Structured output from your research tool
Whatever produces your research needs to output structured data, not just prose. sigint writes JSON findings with confidence, trend, tags, dimension, and sources. If your tool writes markdown only, you lose the ability to filter, aggregate, and compare.
2. A normalization layer
Research sessions produce inconsistent schemas. Build a normalizer that maps variants to a canonical schema. Run it once during the build, so every downstream consumer gets clean data.
3. A build pipeline that composes through files
Each script reads a file, writes a file. The next script reads that file. No shared state, no database. This keeps each piece testable, replaceable, and debuggable. When something breaks, you know which script produced the bad output because each one has exactly one output file.
4. Two search layers
Semantic search for discovery (what concepts relate to my question?). Structured search for precision (show me exactly these criteria). They compose naturally and each stays simple by not trying to do the other’s job.
5. A publication layer
Findings in JSON files are useful to you. Published summaries in GitHub Discussions are useful to everyone. Automated workflows that trigger on data changes keep the publication layer current without manual effort.
6. Derivative content pipelines
The highest-value part. NotebookLM, slide generation, blog post drafting, cross-topic synthesis. Each pipeline reads from the same structured data and produces a different format. Adding a new output format means writing a new consumer, not changing the data layer.
What I Would Do Differently
Three months in, the things I would change:
Tag vocabulary control. Finding-level tags are too granular and domain-specific to create useful cross-topic connections. I get 2,276 tag nodes but only 7 shared-tag edges. Entity enrichment partially compensates, but a controlled vocabulary for finding tags would produce a more connected graph from the start.
Incremental indexing. The build pipeline regenerates everything from scratch. At 1,200 findings this takes under a second, so it does not matter yet. At 10,000 it will. An incremental mode that processes only changed findings would scale better.
Better delta tracking. The update workflow detects new and changed findings, but “changed” is coarse. A finding whose confidence shifted from 0.7 to 0.9 and a finding whose entire summary was rewritten both show as UPDATED. Finer-grained delta types would make the weekly article generator smarter about what is actually newsworthy.
The Numbers
| Metric | Value |
|---|---|
| Research topics | 14 |
| Total structured findings | 1,177 |
| Knowledge graph nodes | 2,363 |
| Knowledge graph edges | 392 |
| Named entities extracted | 26 |
| Standard dimension coverage | 55-73% |
| NLM artifact types | 5 (audio, slides, infographic, video, mind map) |
| Build pipeline scripts | 4 |
| Custom slash commands | 7 |
| Agentic workflows | 3 |
The corpus grows by roughly 2-3 topics per month. Each topic produces 60-100+ findings across 5-7 dimensions. The entire system, from /sigint:start through knowledge graph rebuild through NLM artifact generation, runs on a laptop with no cloud infrastructure beyond GitHub and Google NotebookLM.
Try It
sigint is open source at github.com/zircote/sigint. Install it as a Claude Code plugin and run /sigint:start with any topic.
The research repository patterns (knowledge graph, search, discussions, NLM pipelines) are specific to my setup, but the architecture docs explain every design decision. The explanation docs at docs/explanation/ cover why structured JSON over prose, why jq over SQLite, why committed generated files, why two search layers. If you are building something similar, start there.
The plugin does the research. What you build on top of it is where the value compounds.