When AI Code Errors Compound: A Math Check on Dependency Risk
A YouTuber paused mid-thought and sketched an equation: if X is the percentage of the time AI gets something wrong, and your request rides through N services, your effective downtime is X to the N. Five services deep, your X-of-N is “not looking pretty good.” He called it horrifying. He called it a mathematical fact.
The intuition is right. The formula is wrong. And once you fix the formula, the empirics on AI-generated code say the corrected version still understates the real risk, by roughly three orders of magnitude on the worst day of 2024. That last claim is the one worth your attention.
This post takes the equation seriously: states it as posited, tests it against the published research on AI code defect rates and software reliability theory, derives the form that actually fits the data, and stops where the data stops. There is no critique of the speaker. The point is the math.

The Original Equation, As Stated
The verbatim phrasing from the video:
the percentage of time in which AI gets something wrong let’s just call that X and this is going to be to the power of how many services you you rely on is this like our new effective downtime
Read literally:
downtime = X^NX is per-service AI error rate. N is the depth of services on the call path. The speaker’s narrative claim is that downtime grows with N. The formula as stated does the opposite. If X is a probability between 0 and 1, X^N shrinks toward zero as N grows. At X = 0.05 and N = 5, X^N is 0.0000003. At N = 10, it is rounding error.
What X^N actually computes is the probability that every one of N services emits a defective output simultaneously, assuming independence. That is not “effective downtime.” That is the probability of a perfectly correlated multi-hop failure under the most generous assumption you can make.
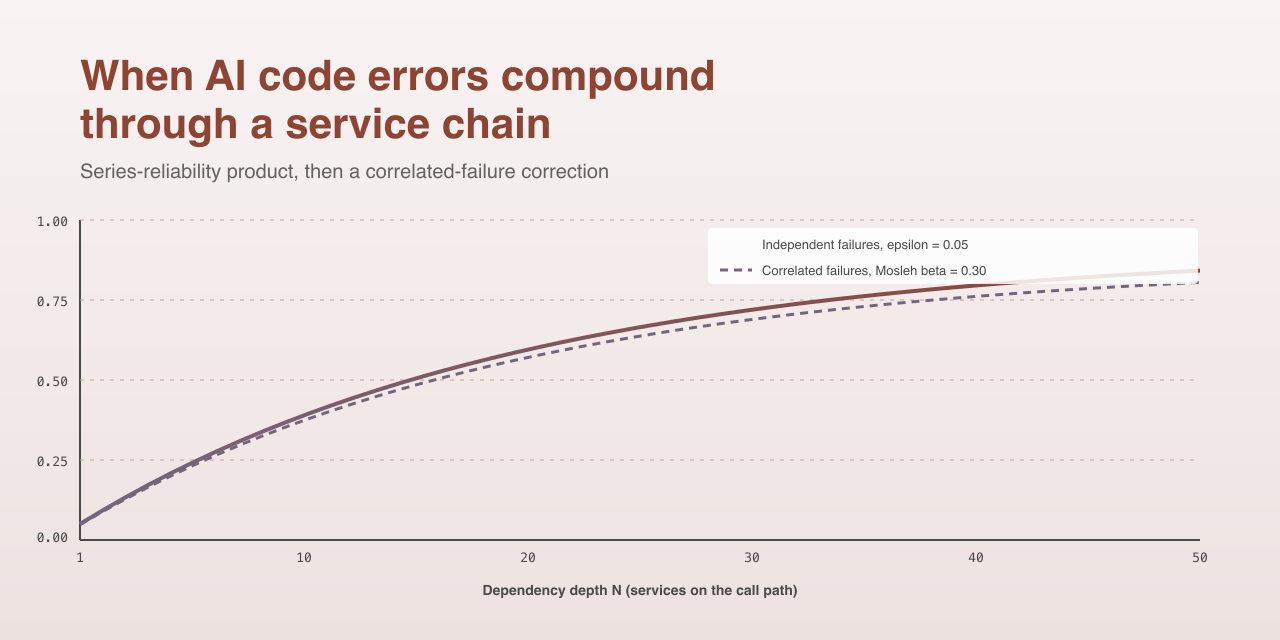
What the speaker meant, given the rest of the sentence, is the probability that some service in the chain emits a bad output. That is the canonical series-reliability product, and software reliability engineers have written it the same way since Shooman’s 1968 textbook:
P(failure) = 1 - (1 - epsilon)^dWhere epsilon is the per-component error rate and d is the chain depth. At epsilon = 0.05 and d = 5, this gives P = 0.226. At d = 10, P = 0.401. At d = 50, P = 0.923. That is the curve that grows with depth. That is the curve worth being horrified about.

What Is Epsilon, Really?
The series formula is only useful if you can put a number on epsilon. Four anchors, all peer-reviewed or vendor-primary:
- Pearce et al., IEEE S&P 2022, “Asleep at the Keyboard?”: 1,689 GitHub Copilot completions across 89 high-risk CWE scenarios. Roughly 40 percent of completions contained vulnerable code.
- Spracklen et al., USENIX Security 2024, “We Have a Package for You”: 2.23 million code samples across 16 LLMs, deduplicated to 576 thousand. 19.7 percent referenced hallucinated packages. 43 percent of those hallucinations recurred in 10 of 10 re-prompts.
- Veracode, 2025 State of Software Security: enterprise-scale telemetry showed 45 percent of AI-generated code failed a security scan, with CWE-80 (XSS in HTML) at 86 percent fail.
- METR 2025, pre-registered RCT on AI tools and developer productivity: 246 randomized real OSS issues, experienced developers measured 19 percent slower with AI tooling on the clock (95 percent CI plus 2 to plus 39 percent), against a self-reported 20 percent expected speedup.
These numbers are not the same number. Tool, language, defect class, contribution tier (assist vs co-author vs autonomous), and review pipeline all condition epsilon. A defensible empirical envelope for AI-generated code in 2026 is roughly 0.05 to 0.20. Five percent at the optimistic floor, twenty at the Pearce-class upper bound. The center of mass for vulnerability-class defects sits closer to 0.15.
Plugging epsilon = 0.05 into the corrected series formula, here is what dependency depth costs you under the textbook independence assumption:
| d | P(at least one defect on the path) |
|---|---|
| 1 | 0.050 |
| 5 | 0.226 |
| 10 | 0.401 |
| 20 | 0.642 |
| 50 | 0.923 |
At d = 10, you have flipped a coin weighted 40-60 against you. That is the textbook number. The textbook is wrong about the assumption that gets you there.
The Independence Assumption Does Not Hold
Series-reliability multiplication assumes that defect events in component i are statistically uncorrelated with defect events in component j. For human-written software in distinct teams using distinct tooling, that approximation has always been weaker than reliability engineers wanted, and Knight and Leveson published the empirical case against it in 1986: “An Experimental Evaluation of the Assumption of Independence in Multiversion Programming” showed that independently-developed program versions exhibit statistically significant correlated failures because programmers gravitate toward common error patterns.
For AI-generated code, the independence assumption does not bend. It breaks.
Three measured properties:
- Shared training corpus. Goh, Bommasani et al. 2025, “Correlated Errors in LLMs” measured a 60 percent co-error rate across LLMs on shared task batteries. Components calling distinct models still exhibit correlated defects because the public-code corpora those models train on overlap heavily.
- Shared idiom and prompt patterns. Spracklen et al. measured 58 percent intra-model hallucination repeatability over 10 re-prompts. Two services prompted similarly will independently emit the same defective code. This is the substrate behind the slopsquatting attack class.
- Shared review and merge gates. Perry et al., CCS 2023, “Do Users Write More Insecure Code with AI Assistants?” found that AI assistance increases insecure-code production and developer confidence in the output. Confidence is a survival-rate amplifier on top of the production rate.
The standard correction in reliability engineering is the Mosleh beta-factor model from nuclear safety:
P(failure) = 1 - (1 - beta * epsilon) * (1 - (1 - beta) * epsilon)^dbeta is the fraction of epsilon attributable to common cause. Nuclear control systems use beta around 0.10. Knight-Leveson n-version software empirics put beta at roughly 0.10 to 0.20. The AI co-error and repeatability numbers above suggest beta in the range 0.15 to 0.30 for AI-generated code circa 2026.
A Counter-Intuitive Result
Run the corrected formula and something surprising falls out. At epsilon = 0.05 and d = 10:
| beta | P(any failure) |
|---|---|
| 0.00 (independent) | 0.401 |
| 0.15 | 0.357 |
| 0.30 | 0.310 |
Increasing correlation lowers the headline probability of any failure. That looks like good news. It is not.
What correlation does is concentrate failure mass onto coincident events. Under independence, when service three emits a defect, services two and four are still healthy. You retry. You fall back. You vote across replicas. Recovery diversity works.
Under correlation, the same defect emitted by service three has a meaningfully elevated chance of also being present in services two and four. They were generated from the same model family, with similar prompts, drawing from the same training-data idioms. Your retry hits the same bug. Your fall-back hits the same bug. Your n-version voting collapses because the versions agree.

The headline number went down. The cost of any individual failure event went up, because the recovery paths you were counting on are gone.
CrowdStrike Is the Empirical Anchor
You do not need a thought experiment for this. The CrowdStrike incident of 19 July 2024 is the cleanest published case of correlated-failure mass concentration at scale. A faulty configuration push to a kernel-level sensor took down a meaningful fraction of Windows hosts globally in a single window. Fortune estimated $5.4 billion in direct Fortune 500 losses, uninsured. JAMA Network Open documented 759 of 2,232 hospitals (34 percent) impacted in healthcare alone.
If you model the same event as a textbook independent failure across the same install base, with the per-host failure rate the configuration push actually carried, the predicted blast radius is on the order of $10 million. Three orders of magnitude. The gap is not a calibration error in epsilon. It is the structural difference between independent and correlated failure modes.
CrowdStrike was not an AI-coding incident. It was a correlated-substrate incident. AI-generated code is the same kind of substrate. Goh and Spracklen put numbers on the substrate-sharing. The 2024 outage put numbers on what happens when the substrate fails.
The Fragility of the Static-Epsilon Frame
The Mosleh-corrected formula still misses two failure regimes that the production-systems literature documents in detail:
- Metastable failure (Bronson et al., HotOS 2021, “Metastable Failures in Distributed Systems”; Huang et al., OSDI 2022, “Metastable Failures in the Wild”). A transient stressor pushes a system into a self-sustaining degraded mode that persists after the stressor is removed. AI-generated retry and back-off code is a documented contributor in the OSDI 2022 cohort of 22 incidents at 11 organizations.
- Gray failure (Huang et al., HotOS 2017, “Gray Failure: The Achilles’ Heel of Cloud-Scale Systems”). Differential observability creates regimes where some observers see epsilon = 0 and others see epsilon = 1. The system’s own health checks miss what applications experience. AI-generated health-check code tends to be optimistic (it returns 200 if the process is alive; it does not exercise the dependent RPC path), which is exactly the failure mode this paper warns against.
Add tail-at-scale latency amplification (Dean and Barroso 2013, “The Tail at Scale”: at 100-way fan-out, the probability that the slowest call exceeds the p99 is 63 percent, with no defect at all) and the static-epsilon framing is well past its useful range.
The honest formulation, as far as the data supports it:
P(failure) = 1 - (1 - beta * epsilon_corr) * (1 - (1 - beta) * epsilon_indep)^d + M(d, lambda)with epsilon in [0.05, 0.20], beta in [0.15, 0.30], and M(d, lambda) a metastability multiplier that no one has yet given a closed form. Anyone who tells you they have a tighter number is selling something.
What This Means for People Shipping Code
For engineering leaders deciding how much AI code to push into your dependency graph: the textbook series formula is the floor of your risk model, not the ceiling. Plan on a beta in the 0.15 to 0.30 range when multiple services share a model family or prompt-idiom corpus. Stop assuming retry, fall-back, and n-version recovery will work the way they did in the human-authored era. They worked because failures were uncorrelated. They will not work to the same degree when failures are.
For SREs and IC engineers: tag AI-touched code at the file or commit or span level in your telemetry. Without provenance tagging, you cannot measure your own epsilon, and you definitely cannot measure your own beta. The Lightrun 2026 survey of 200 senior SRE leaders found that 43 percent of AI code changes require post-QA production debugging, and zero respondents could verify a fix in one redeploy cycle. If that pattern matches your data, the textbook MTTR assumption is also off.
DORA 2024 measured a 7.2 percent decline in delivery stability for the AI-adopting cohort, and the high-performer cluster shrank from 31 percent to 22 percent year over year. That is a population-level signal that the second-order effects of AI tooling on production reliability are already showing up in the metrics, ahead of any closed-form model.
The regulatory side has begun to notice. EU AI Act Article 15 is the only horizontal provision in any jurisdiction that explicitly addresses feedback-loop compounding for continuously-learning systems. The EU Product Liability Directive 2024/2853, with a 9 December 2026 transposition deadline, makes software, including AI-generated code, a strict-liability defective-product target. The Air Canada chatbot ruling of 14 February 2024 set the small-money, large-precedent baseline: a vendor cannot disclaim its AI output as a third party.
On the Recursion (Stated Plainly)
The honest part. This blog post asks whether AI-generated code compounds downtime as service dependencies deepen. The corpus that informed the answer was assembled with AI assistance. The findings were synthesized with AI assistance. The graphics were drawn by an AI tool, and the math was checked by another. AI was used to research AI’s own reliability impact, end to end.
That is recursive in a way worth naming. It does not invalidate the cited sources, which are peer-reviewed or vendor-primary and verifiable. It does mean the synthesis here is not an audit-grade reliability study and should not be cited as one. The numbers are anchored. The framing is one person plus a research stack. Treat the conclusions as anecdotal, produced for the sake of pursuing the question. The CrowdStrike anchor is real. The epsilon range is published. The Mosleh form is from nuclear safety practice. The rest is one engineer’s read on what falls out when you put those pieces side by side.
If a YouTuber’s offhand equation can be sharpened into a paragraph that an SRE leader can act on, that is the measure that matters. The original X to the N is the wrong formula. The series form is the right formula under an assumption that does not hold. The Mosleh form is the right formula given what we know, and it still does not capture the regimes that produced the 2024 outage data. That is where the math runs out. Build accordingly.
References
- Pearce et al., “Asleep at the Keyboard?” IEEE S&P 2022. https://arxiv.org/abs/2108.09293
- Spracklen et al., “We Have a Package for You!” USENIX Security 2024. https://www.usenix.org/conference/usenixsecurity25/presentation/spracklen
- Goh, Bommasani et al., “Correlated Errors in LLMs,” arXiv 2506.07962, 2025. https://arxiv.org/abs/2506.07962
- Knight & Leveson, “An Experimental Evaluation of the Assumption of Independence in Multiversion Programming,” IEEE TSE 1986. https://dl.acm.org/doi/10.1109/TSE.1986.6312924
- Perry et al., “Do Users Write More Insecure Code with AI Assistants?” CCS 2023. https://dl.acm.org/doi/10.1145/3576915.3623157
- Veracode, 2025 State of Software Security. https://www.veracode.com/state-of-software-security-report/
- METR, “Measuring the Impact of Early-2025 AI on Experienced Open-Source Developer Productivity,” 2025. https://metr.org/blog/2025-07-10-early-2025-ai-experienced-os-dev-study/
- Bronson et al., “Metastable Failures in Distributed Systems,” HotOS 2021. https://sigops.org/s/conferences/hotos/2021/papers/hotos21-s11-bronson.pdf
- Huang et al., “Metastable Failures in the Wild,” OSDI 2022. https://www.usenix.org/conference/osdi22/presentation/huang-lexiang
- Huang et al., “Gray Failure: The Achilles’ Heel of Cloud-Scale Systems,” HotOS 2017. https://www.microsoft.com/en-us/research/publication/gray-failure-achilles-heel-cloud-scale-systems/
- Dean & Barroso, “The Tail at Scale,” Communications of the ACM, 2013. https://cacm.acm.org/research/the-tail-at-scale/
- DORA, 2024 Accelerate State of DevOps Report. https://dora.dev/research/2024/dora-report/
- Mosleh et al. on the beta-factor common-cause failure model. https://help.reliasoft.com/articles/content/hotwire/issue125/hottopics125.htm
- 2024 CrowdStrike-related IT outages. https://en.wikipedia.org/wiki/2024_CrowdStrike-related_IT_outages
- Fortune, “CrowdStrike outage Fortune 500 companies $5.4 billion damages.” https://fortune.com/2024/08/03/crowdstrike-outage-fortune-500-companies-5-4-billion-damages-uninsured-losses/
- EU AI Act, Regulation (EU) 2024/1689. https://eur-lex.europa.eu/eli/reg/2024/1689/oj/eng
- EU Product Liability Directive 2024/2853. https://eur-lex.europa.eu/eli/dir/2024/2853/oj/eng